Independent portfolio analysis / Synthetic data / 2026
Before changing the offer,
check the comparison.
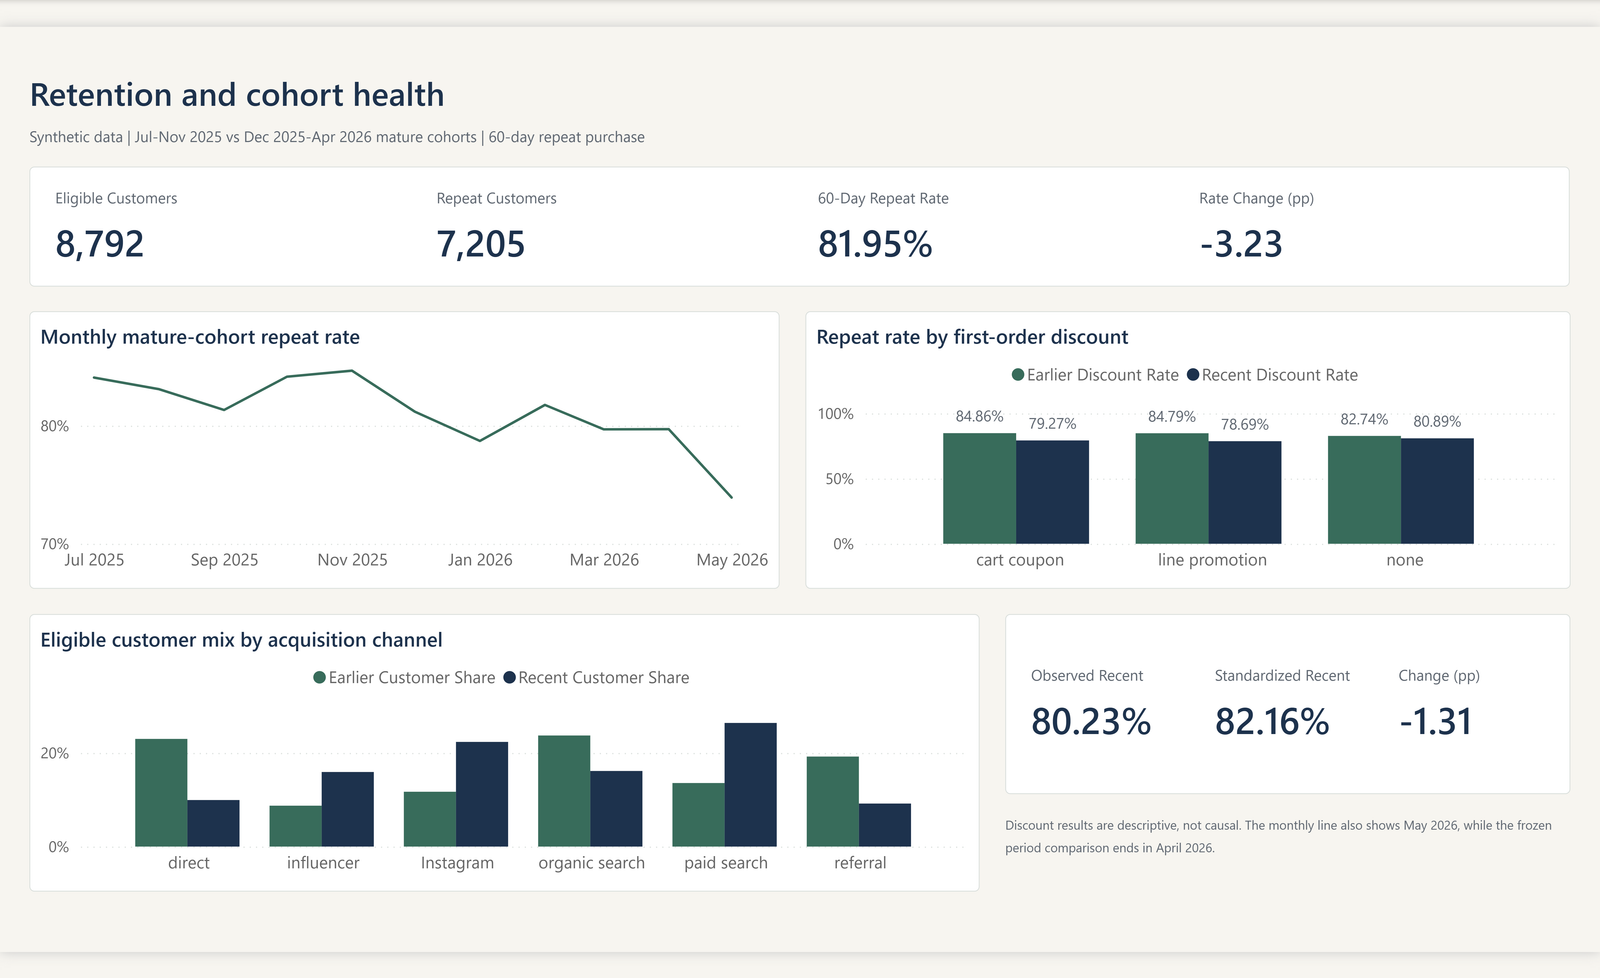
The estimated retention decline became smaller after checking customer mix. That changed the interpretation. It did not establish a reason to change discounts.
- My work
- Metric definition, data checks,
analysis and interpretation - Data
- 10,000 synthetic customers
30,095 distinct orders - Tools
- SQL, Python and Power BI
- Outcome
- A qualified recommendation
and a measurement plan
01 / The comparison
A different mix changes
what the decline means.
The recent period had a lower observed repeat-purchase rate. Reweighting its channel-level rates to the earlier customer mix made the estimated gap smaller.
| Comparison with earlier period | Estimated decline | Interpretation |
|---|---|---|
| Recent observed | 3.23 percentage points | Unadjusted period comparison |
| Recent standardised | 1.31 percentage points | Earlier channel mix held constant |
Inspect channel mix and the SQL boundary
Earlier and recent shares among eligible mature cohorts. The standardised estimate uses the earlier shares and recent channel-level repeat rates.
| Channel | Earlier share | Recent share |
|---|---|---|
| 11.7% | 22.4% | |
| direct | 23.0% | 9.9% |
| influencer | 8.7% | 15.9% |
| organic search | 23.7% | 16.2% |
| paid search | 13.6% | 26.4% |
| referral | 19.2% | 9.2% |
Day 60 counts. Day 61 does not.
        AND repeat_order.qualifying_order
        AND repeat_order.ordered_at > first_order.first_qualifying_order_at
        AND repeat_order.ordered_at <= first_order.first_qualifying_order_at + INTERVAL 60 DAY
Exact excerpt from sql/02_customer_models.sql in the synthetic project. The qualifying-order model excludes cancelled and fully refunded orders; the eligibility flag requires a complete follow-up window. AI assisted implementation.
Displayed percentages are rounded. Subtracting them can differ by 0.01 point from the reported gaps.
02 / Before interpreting a metric
First, make the denominator
worth trusting.
A full follow-up window
A customer needed the full 60-day observation window to enter the retrospective denominator. A repeat on day 60 counts; a repeat on day 61 does not.
Comparable eligible cohorts
The earlier July–November 2025 group contained 4,669 eligible customers. The recent December 2025–April 2026 group contained 4,123.
03 / The grain check
More joined rows
didn’t mean more orders.
Orders, order items and delivery events live at different grains. Joining them directly multiplied rows and put order counts and monetary totals at risk.
I kept those grains separate and aggregated before joining. The raw order file had 30,096 rows; reconciliation left 30,095 distinct orders.
04 / The decision
I would not use this analysis
to justify changing discounts.
The comparison showed associations, not a causal discount effect. Stable campaign IDs, eligibility and assignment context were missing. The next step was better promotion measurement before testing a change.
This is a synthetic portfolio exercise. No live intervention was run and no real customer retention improvement is claimed.
05 / Method and limits
The details
behind the decision.
Feedback-classifier check
The small evaluation used 17 unique held-out texts. Sixteen were labelled correctly, with macro-F1 of 0.933. The sample is small, single-reviewer and has independence limitations. The 1,148 repeated synthetic rows are not 1,148 independent tests.
Contribution and implementation assistance
I defined and reviewed the analytical questions, metric rules, reconciliation checks and interpretation. AI tools assisted implementation. The project is not presented as unaided coding.
What this analysis cannot establish
Synthetic data cannot prove a real commercial effect. Customer-mix standardisation does not remove every possible confounder. Without reliable promotion-assignment information, the discount comparison cannot establish causation.